With a proper interpretation of the basal temperature chart, in a few months you can get a clear idea of the state of the female reproductive system. And in particular to find out whether ovulation occurs, and what days can be considered favorable for conception, to determine whether the cycle has become fateful or to suggest another reason for the delay in menstruation.
More details about the features of compiling and decoding the basal temperature graph will be discussed in this article.
How to build a basal temperature chart?
The algorithm for scheduling is extremely simple, but requires the following rules:
- First, BT (basal temperature) should be measured for 5-7 minutes daily at the same time while in bed;
- secondly, the procedure should be performed at least after a 6-hour continuous sleep;
- thirdly, for these purposes it is better to use one thermometer, preferably a mercury thermometer.
Measurements should be recorded in a special template, so building a correct basal temperature chart will not be difficult. The workpiece can be made independently, on a sheet of paper in a box or on a computer. To do this, you need to set the temperature from 36.2 to 37.6 degrees vertically, and horizontally the numbers to be measured. Then, every morning, record the data by making a note at the intersection of the number and the corresponding temperature.
For those who have free access to the World Wide Web, you can use online services or download a template and print it on your home printer.
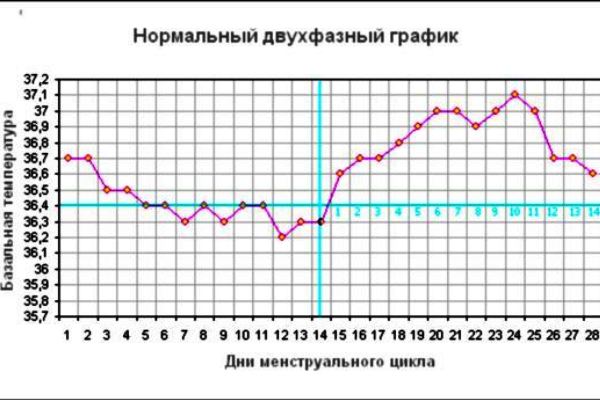
Normal basal temperature chart
To judge the presence or absence of pathology, you can if you know what a normal basal temperature chart looks like in a healthy woman with a two-phase cycle.
So, normally, in the first phase, the range of BT values is in the range from 36, 2 to 36.7 degrees, but it does not exceed 37, which indicates a high level of estrogens. A couple of days before ovulation, the BT value drops sharply. After the release of the mature egg, the second, luteal phase begins, for which the increase in BT by 0.4-0.6 degrees is typical. This is due to a sharp increase in the level of progesterone and the creation of favorable conditions for the development of pregnancy. As a rule, in the second phase, the value of BT is kept at 37 degrees or higher.
If the conception did not take place - this will affect the schedule by lowering the temperature on the eve of menstruation.
While on the pregnant schedule a short-term basal temperature drop is observed approximately on the 7th day after ovulation, after which the BT curve again rushes upward.
With a successful development of pregnancy, high BT remains for 9 months.
Features of BT schedules in the presence of pathology
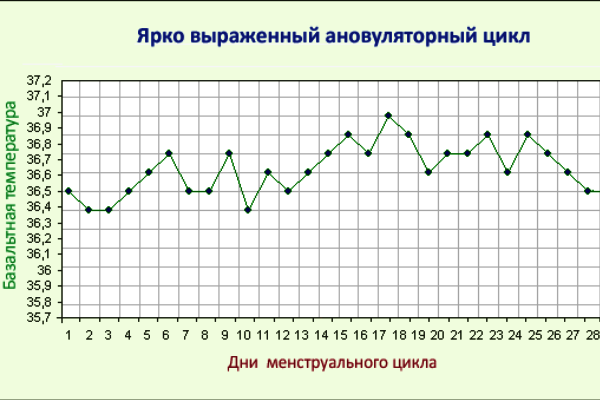
- Absence of ovulation. If the cycle is anovulatory, then on the chart of basal temperature there will be no sharp fluctuations, and the temperature does not rise above the mark of 37 degrees
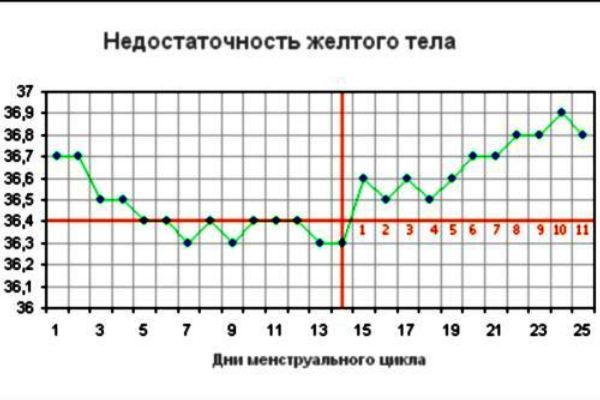
- Insufficiency of the yellow body. In this case, the following picture is observed: BT rises only towards the end of the cycle, with no characteristic decrease before ovulation.
- Insufficiency of estrogens. This violation is accompanied by sharp ups and downs of temperature. In the first phase, its value often exceeds the allowable value.
- Inflammation of the appendages. Inflammatory processes in the pelvic organs can not but affect the values of BT. On such a chart, it is difficult to determine ovulation, as sharp declines and ups are encountered many times.